My good friend Matt and I graduated college the same year. I went off into the work world and he headed for a graduate degree program in nuclear engineering. Much of the research effort in nuclear engineering is centered around developing sustainable fusion technology. Matt quickly realized that something was off.
So he went to his faculty adviser, who had been pursuing fusion research for several decades, and asked him, “I’m in my early 20’s, do you think that we will achieve viable fusion technology in my lifetime?”
The advisor’s answer was an involved discussion of “No.” Sustainable fusion technology involves an entire collection of problems that we are not close to solving. The materials science alone required to construct a vessel to hold the fusion reaction and extract power from it safely is well beyond our current capabilities even decades after my friend had the conversation with his advisor.
Happily for my friend, he had this conversation before he had sunk too much time into his research. Matt bailed out of nuclear engineering, changed his research focus, and has had a highly successful career in engineering education.
Meanwhile, I had been lucky enough to land a job doing Unix support at AT&T Bell Labs. One of the projects we supported was a research group that was working to develop a bespoke system that implemented Karmarkar’s algorithm for linear programming. This was an enormous project that employed hundreds of developers and consumed huge amounts of resources. The customers were the major airlines– scheduling aircraft and the flight crews that staff them is a classic problem in linear programming that directly impacts the bottom line of these companies.
You likely have never heard of Karmarkar’s algorithm, except perhaps for the controversy around it. Initially hailed as a major step forward that would revolutionize linear programming, its detractors claimed that, upon closer scrutiny, this so-called “revolutionary” algorithm was just a combination of known heuristics and speedups. It was not a substantial improvement over existing algorithms of the time.
I never studied the algorithm enough to determine which side’s claims were correct. What I do know is that the airlines pulled their funding and AT&T’s project was scuttled. The IT support team came in on Monday and everybody who was working on that project was literally gone. We moved through their empty office space for the next week collecting computer equipment to be repurposed for other projects. Some of the developers got shifted to other projects as well, but I imagine many people suddenly found themselves looking for work.
The airlines poured millions of dollars into a project that produced exactly nothing of value. Governments around the world continue to pour billions into fusion research with little to show for it and very little hope of fusion power in our lifetimes. Why is so much time, effort, and money being wasted?
These projects have several factors in common. Their goal is highly desirable: a “revolution” that would reshape the world as we know it, or at least an entire industry. The path involves highly complex technology that is impenetrable to a non-specialist: a complex algorithm or deep scientific research necessary to invent things that have never been done before. And they require massive amounts of funding.
This is a perfect recipe for bad decision making or outright fraud. People will sacrifice a great deal to achieve a significant goal. Because the path to that goal is difficult to comprehend, people will fool themselves into thinking the solution is “just around the corner”. Critical thinking skills fly out the window as people focus on the goal and can’t or won’t focus on the process to get there.
And when the project attracts unscrupulous operators who realize that there is money to be made in prolonging the effort, you have the makings of a bezzle. The unscrupulous promise a wonderful new world but use any excuse to keep extracting money from the situation. When challenged about their lack of results they just say, “Technology is complex and unpredictable, but I swear we are almost there!” Technology is a perfect breeding ground for bezzles because we have socialized the idea that computers and technology are inscrutable to mere mortals who must defer to a high priesthood to interpret the signs and omens.
“Generative AI” and “large language models” are the latest techno bezzle. But “AI” is a constant and recurring bezzle that I have seen numerous times in my decades in technology. Remember “machine learning”? Remember “neural networks”? I have lived through too many of these hype cycles and seen too many people lose their jobs and/or retirement funds due to companies that bet the farm on the latest bezzle.
The AI hype is too strong right now for me to convince people caught up in it that they are being conned. But for the rest of you I want you to recognize the patterns at play here and apply your critical thinking skills to any new “revolutionary” technologies that follow a similar path. And try to educate others so that we don’t as a society keep making the same sorts of mistakes over and over again. The resources we are wasting on the current AI hype cycle are killing the planet and could be put to so much better use.
Many years ago I did a breakdown of the EXT4 file system. I devoted an entire blog article to the new timestamp system used by EXT4. The trick is that EXT4 added 32-bit nanosecond resolution fractional seconds fields in its extended inode. But you only need 30 bits to represent nanoseconds, so EXT4 uses the lower two bits of the fractional seconds fields to extend the standard Unix “epoch time” timestamps. This allows EXT4 to get past the Y2K-like problem that normal 32-bit epoch timestamps face in the year 2038.
At the time I wrote, “With the extra two bits, the largest value that can be represented is 0x03FFFFFFFF, which is 17179869183 decimal. This yields a GMT date of 2514-05-30 01:53:03…” But it turns out that I misunderstood something critical about the way EXT4 handles timestamps. The actual largest date that can be represented in an EXT4 file system is 2446-05-10 22:38:55. Curious about why? Read on for a breakdown of how EXT4 timestamps are encoded, or skip ahead to “Practical Applications” to understand why this knowledge is useful.
Traditional Unix File System Timestamps
Traditionally, file system times in Unix/Linux are represented as “the number of seconds since 00:00:00 Jan 1, 1970 UTC”– typically referred to as Unix epoch time. But what if you wanted to represent times before 1970? You just use negative seconds to go backwards.
So Unix file system times are represented as signed 32-bit integers. This gives you a time range from 1901-12-13 20:45:52 (-2**31 or 0x80000000 or -2147483648 seconds) to 2038-01-19 03:14:07 (2**31 - 1 or 0x7fffffff or 2147483647 seconds). When January 19th, 2038 rolls around, unpatched 32-bit Unix and Linux systems are going to be having a very bad day. Don’t try to tell me there won’t be critical applications running on these systems in 2038– I’m pretty much basing my retirement planning on consulting in this area.
What Did EXT4 Do?
EXT4 had those two extra bits from the fractional seconds fields to play around with, so the developers used them to extend the seconds portion of the timestamp. When I wrote my infamous “timestamps good into year 2514” comment in the original article, I was thinking of the timestamp as an unsigned 34-bit integer 0x03ffffffff. But that’s not right.
EXT4 still has to support the original timestamp range from 1901 – 2038 and the epoch still has to be based around the January 1, 1970 or else chaos will ensue. So the meaning of the original epoch time values hasn’t changed. This field still counts seconds from -2147483648 to 2147483647.
So what about the extra two bits? With two bits you can enumerate values from 0-3. EXT4 treats these as multiples of 2*32 or 4294967296 seconds. So, for example, if the “extra” bits value was 2 you would start with 2 * 4294967296 = 8589934592 seconds and then add whatever value is in the standard epoch seconds field. And if that epoch seconds value was negative, you end up adding a negative number, which is how mathematicians think of subtraction.
This insanity allows EXT4 to cover a range from (0 * 4294967296 - 2147483648) aka -2147483648 seconds (the traditional 1901 time value) all the way up to (3 * 4294967296 + 2147483647) = 15032385535 seconds. That timestamp is 2446-05-10 22:38:55, the maximum EXT4 timestamp. If you’re still around in the year 2446 (and people are still using money) then maybe you can pick up some extra consulting dollars fixing legacy systems.
At this point you may be wondering why the developers chose this encoding. Why not just use the extra bits to make a 34-bit signed integer? A 34-bit signed integer would have a range from -2**33 = -8589934592 seconds to 2**33 - 1 = 8589934591 seconds. That would give you a range of timestamps from 1697-10-17 11:03:28 to 2242-03-16 12:56:31. Being able to set file timestamps back to 1697 is useful to pretty much nobody. Whereas the system the EXT4 developers chose gives another 200 years of future dates over the basic signed 34-bit date scheme.
Practical Applications
Why I am looking so closely at EXT4 timestamps? This whole business started out because I was frustrated after reading yet another person claiming (incorrectly) that you cannot set ctime and btime in Linux file systems. Yes, the touch command only lets you set atime and mtime, but touch is not the only game in town.
For EXT file systems, the debugfs command allows writing to inode fields directly with the set_inode_field command (abbreviated sif). This works even on actively mounted file systems:
The set_inode_field command needs the inode number, the name of the field you want to set (you can get a list of field names with set_inode_field -l), and the value you want to set the field to. In the example above, I’m setting the crtime field (which is how debugfs refers to btime). debugfs wants you to provide the value as an epoch time value– either in hex starting with “0x” or in decimal preceded by “@“.
What often trips people up when they try this is caching. Watch what happens when I use the standard Linux stat command to dump the file timestamps:
The btime appears to be unchanged! The inode value has changed, but the operating system hasn’t caught up to the new reality yet. Once I force Linux to drop it’s out-of-date cached info, everything looks as it should:
If I wanted to set the fractional seconds field, that would be crtime_extra. Remember, however, that the low bits of this field are used to set dates far into the future:
For the *_extra fields, debugfs just wants a raw number either in hex or decimal (hex values should still start with “0x“).
Making This Easier
Human beings would like to use readable timestamps rather than epoch time values. The good news is that GNU date can convert a variety of different timestamp formats into epoch time values:
root@LAB:~# date -d '2345-01-01 12:34:56' '+%s'
11833925696
Specify whatever time string you want to convert after the -d option. The %s format means give epoch time output.
Now for the bad news. The value that date outputs must be converted into the peculiar encoding that EXT4 uses. And that’s why I spent so much time fully understanding the EXT4 timestamp format. That understanding leads to some crazy shell math:
# Calculate a random nanoseconds value
# Mask it down to only 30 bits, shift right two bits
nanosec="0x$(head /dev/urandom | tr -d -c 0-9a-f | cut -c1-8)"
nanosec=$(( ($nanosec & 0x3fffffff) << 2) ))
# Get an epoch time value from the date command
# Adjust the time value to a range of all positive values
# Calculate the number for the standard seconds field
# Calculate the bits needed in the *_extra field
epoch_time=$(date -d '2345-01-01 12:34:56' '+%s)
adjusted_time=$(( $epoch_time + 2147483648 ))
time_lowbits=$(( ($adjusted_time % 4294967296) - 2147483648 ))
time_highbits=$(( $adjusted_time / 4294967296 ))
# The *_extra field value combines extra bits with nanoseconds
extra_field=$(( $nanosec + $time_highbits ))
Clearly nobody wants to do this manually every time. You just want to do some timestomping, right? Don’t worry, I’ve written a script to set timestamps in EXT:
Use the -macb options to specify the timestamps you want to set and -T to specify your time string. You can use -e to specify nanoseconds if you want, otherwise the script just generates a random nanoseconds value. The script is usually silent but -v causes the script to output the file timestamps when it’s done. The script even drops the file system caches automatically for you (unless you use -C to keep the old cached info).
And because you often want to blend in with other files in the operating system, I’ve included an option to copy the timestamps from another file:
It’s particularly easy to do this timestomping on EXT because debugfs allows us to operate on live file systems. In “expert mode” (xfs_db -x), the xfs_db tool has a write command that allows you to set inode fields. Unfortunately, by default xfs_db does not allow writing to mounted file systems. Of course, an enterprising individual could modify the xfs_db source code and bypass these safety checks.
And that’s really the bottom line. Use the debugging tool for whatever file system you are dealing with to set the timestamp values appropriately for that file system. It may be necessary to modify the code to allow operation on live file systems, but tweaking timestamp fields in an inode while the file system is running is generally not too dangerous.
While I haven’t been happy about Systemd’s continued encroachment into the Linux operating system, I will say that the Systemd journal is generally an upgrade over traditional Syslog. We’ve reached the point where some newer distributions are starting to forgo Syslog and traditional Syslog-style logs altogether. The challenge for DFIR professionals is that the Systemd journals are in a binary format and require a command-line tool, journalctl, for searching and text output.
The main advantage that Systemd journals have over traditional Syslog-style logs is that Systemd journals carry considerably more metadata related to log messages, and this metadata is broken down into multiple searchable fields. A traditional Syslog log message might look like:
Jul 21 11:22:02 LAB sshd[1304]: Accepted password for lab from 192.168.10.1 port 56280 ssh2
The Systemd journal entry for the same message is:
Any of these fields is individually searchable. The journalctl command provides multiple pre-defined output formats, and custom output of specific fields is also supported.
Systemd uses a simple serialized text protocol over HTTP or HTTPS for sending journal entries to remote log collectors. This protocol uses port 19532 by default. The URL of the remote server is normally found in the /etc/systemd/journal-upload.conf file. On the receiver, configuration for handling the incoming messages is defined in /etc/systemd/journal-remote.conf. A “pull” mode for requesting journal entries from remote systems is also supported, using port 19531 by default.
Journal Time Formats
As you can see in the JSON output above, the Systemd journal supports multiple time formats. The primary format is a Unix epoch style UTC time with an extra six digits for microsecond precision. This is the format for the _SOURCE_REALTIME_TIMESTAMP and __REALTIME_TIMESTAMP fields. Archived journal file names (see below) use a hexadecimal form of this UTC time value.
Note that _SOURCE_REALTIME_TIMESTAMP is the time when systemd-journald first received the message on the system where the message was originally generated. If the message was later relayed to another system using the systemd-journal-remote service, __REALTIME_TIMESTAMP will reflect the time the message was received by the remote system. In the journal on the originating system, _SOURCE_REALTIME_TIMESTAMP and __REALTIME_TIMESTAMP are usually the same value.
I have created shell functions for converting both the decimal and hexadecimal representations of this time format into human-readable time strings:
function jtime { usec=$(echo $1 | cut -c11-); date -d @$(echo $1 | cut -c 1-10) "+%F %T.$usec %z"; }
function jhextime { usec=$(echo $((0x$1)) | cut -c11-); date -d @$(echo $((0x$1)) | cut -c 1-10) "+%F %T.$usec %z"; }
Journal entries also contain a __MONOTONIC_TIMESTAMP field. This field represents the number of microseconds since the system booted. This is the same timestamp typically seen in dmesg output.
Journal entries will usually contain a SYSLOG_TIMESTAMP field. This text field is the traditional Syslog-style timestamp format. This time is in the default local time zone for the originating machine.
Journal Files Location and Naming
Systemd journal files are typically found under /var/log/journal/MACHINE_ID. The MACHINE_ID is a random 128-bit value assigned to each system during the first boot. You can find the MACHINE_ID in the file /etc/machine-id file.
Under the /var/log/journal/MACHINE_ID directory, you will typically find multiple files:
The system.journal file is where logs from operating system services are currently being written. The other system@*.journal files are older, archived journal files. The systemd-journald process takes care of rotating the current journal and purging older files based on parameters configured in /etc/systemd/journald.conf.
The naming convention for these archived files is system@fileid-seqnum-time.journal. fileid is a random 128-bit file ID number. seqnum is the sequence number of the first message in the journal file. Sequence numbers are started at one and simply increase monotonically with each new message. time is the hexadecimal form of the standard journal UTC Unix epoch timestamp (see above). This time matches the __REALTIME_TIMESTAMP value of the first message in the journal– the time that message was received on the local system.
File names that end in a tilde– like the system@00061db4ac78a3a2-03652b1534b78cc1.journal~ file– are files that systemd-journald either detected as corrupted or which were ended by an unclean shutdown of the operating system. The first field after the “@” is a hex timestamp value corresponding to when the file was renamed as an archive. This is often when the system reboots, if the operating system crashed. I have been unable to determine how the second hex string is calculated.
In addition to the system*.journal files, the journal directory may also contain one or more user-UID*.journal files. These are user-specific logs where the UID corresponds to each user’s UID value in the third field of /etc/passwd. The naming convention on the user-UID*.journal files is the same as for the system*.journal files.
The journalctl Command
Because the journalctl command has a large number of options for searching, output formats, and more, I have created a quick one-page cheat sheet for the journalctl command. You may want to refer to the cheat sheet as you read through this section.
My preference is to “export SYSTEMD_PAGER=” before operating the journalctl command. Setting this value to null means that long lines in the journalctl output will wrap onto the next line of your terminal rather than creating a situation where you need to scroll the lines to the right to see the full message. If you want to look at the output one screenful at a time, you can simply pipe the output into less or more.
SELECTING FILES
By default the journalctl command operates on the local journal files in /var/log/journal/MACHINE_ID. If you wish to use a different set of files, you can specify an alternate directory with “-D“, e.g. “journalctl -D /path/to/evidence ...“. You can specify an individual file with “--file=” or use multiple “--file” arguments on a single command line. The “--file” option also accepts normal shell wildcards, so you could use “journalctl --file=system@\*” to operate just on archived system journal files in the current working directory. Note the extra backslash (“\“) to prevent the wildcard from being interpreted by the shell.
“journalctl --header” provides information about the contents of one or more journal files:
# journalctl --header --file=system@00061db4ac78a3a2-03652b1534b78cc1.journal~
File path: system@00061db4ac78a3a2-03652b1534b78cc1.journal~
File ID: a98f5eb8aff543a8abdee01518dd91f0
Machine ID: 47b59f088dc74eb0b8544be4c3276463
Boot ID: 9ac272cac6c040a7b9ad021ba32c2574
Sequential number ID: 7166038d7a284f0f9f3c1aa7fab3f251
State: OFFLINE
Compatible flags:
Incompatible flags: COMPRESSED-LZ4
Header size: 256
Arena size: 33554176
Data hash table size: 211313
Field hash table size: 333
Rotate suggested: no
Head sequential number: 27899 (6cfb)
Tail sequential number: 54724 (d5c4)
Head realtime timestamp: Sun 2024-07-14 16:18:40 EDT (61d3ad1816828)
Tail realtime timestamp: Sat 2024-07-20 08:55:01 EDT (61dad51f51a90)
Tail monotonic timestamp: 2d 1min 22.016s (284092380c)
Objects: 116042
Entry objects: 26326
Data objects: 64813
Data hash table fill: 30.7%
Field objects: 114
Field hash table fill: 34.2%
Tag objects: 0
Entry array objects: 24787
Deepest field hash chain: 2
Deepest data hash chain: 4
Disk usage: 32.0M
The most useful information here is the first (“Head“) and last (“Tail“) timestamps in the file along with the object counts.
OUTPUT MODES
The default output mode for journalctl is very similar to a typical Syslog-style log:
# journalctl -t sudo -r
-- Journal begins at Sat 2023-02-04 15:59:52 EST, ends at Sun 2024-07-21 13:00:01 EDT. --
Jul 21 07:34:01 LAB sudo[1491]: pam_unix(sudo:session): session opened for user root(uid=0) by lab(uid=1000)
Jul 21 07:34:01 LAB sudo[1491]: lab : TTY=pts/1 ; PWD=/home/lab ; USER=root ; COMMAND=/bin/bash
Jul 21 07:22:09 LAB sudo[1432]: pam_unix(sudo:session): session opened for user root(uid=0) by lab(uid=1000)
Jul 21 07:22:09 LAB sudo[1432]: lab : TTY=pts/0 ; PWD=/home/lab ; USER=root ; COMMAND=/bin/bash
-- Boot 93616c3bb5794e0099520b2bf974d1bc --
Jul 21 07:17:11 LAB sudo[1571]: pam_unix(sudo:session): session closed for user root
Jul 21 07:17:11 LAB sudo[1512]: pam_unix(sudo:session): session closed for user root
[...]
Note that here I am using the “-r” flag so that the most recent entries are shown first rather than the normal ordering of oldest to newest as you would normally read them in a log file.
The main differences between the default journalctl output and default Syslog-style output is the “Journal begins at...” header line and the markers that show which boot session the log messages were generated in. Like normal Syslog logs, the timestamps are shown in the default time zone for the machine where you are running the journalctl command.
If you want to hide the initial header, specify “-q” (“quiet“). If you want to force UTC timestamps, the option is “--utc“. You can hide the boot session information by choosing any one of several output modes with “-o“. Here is a single log message formatted with some of the different output choices:
-o short
Jul 21 07:33:36 LAB sshd[1478]: Accepted password for lab from 192.168.10.1 port 56282 ssh2
-o short-full
Sun 2024-07-21 07:33:36 EDT LAB sshd[1478]: Accepted password for lab from 192.168.10.1 port 56282 ssh2
-o short-iso
2024-07-21T07:33:36-0400 LAB sshd[1478]: Accepted password for lab from 192.168.10.1 port 56282 ssh2
-o short-iso-precise
2024-07-21T07:33:36.610329-0400 LAB sshd[1478]: Accepted password for lab from 192.168.10.1 port 56282 ssh2
My personal preference is “-q --utc -o short-iso“. If you have a particular preferred output style, you might consider making it an alias so you’re not constantly having to retype the options. In my case the command would be “alias journalctl='journalctl -q --utc -o short-iso'“.
The “-o” option also supports several different JSON output formats. If you are looking to consume journalctl output with a script, you probably want “-o json” which formats all fields in each journal entry as a single long line of minified JSON. “-o json-pretty” is a multi-line output mode that I find useful when I’m trying to figure out which fields to construct my queries with. The JSON output at the top of this article was created with “-o json-pretty“.
In JSON output modes, you can output a custom list of fields with the “--output-fields=” option:
Notice that the __CURSOR, __REALTIME_TIMESTAMP, __MONOTONIC_TIMESTAMP, and _BOOT_ID fields are always printed even though we did not specifically select them.
“-o verbose --output-fields=...” gives only the requested fields plus __CURSOR but does so without the JSON formatting. “-o cat --output-fields=...” gives just the field values with no field names and no extra fields.
MATCHING MESSAGES
In general you can select messages you want to see by matching with “FIELD=value“, e.g. “_UID=1000“. You can specify multiple selectors on the same command line and the journalctl command assumes you want to logically “AND” the selections together (intersection). If you want logical “OR”, use a “+” between field selections, e.g. “_UID=0 + _UID=1000“.
Earlier I mentioned using “-o json-pretty” to help view fields that you might want to match on. “journalctl -N” lists the names of all fields found in the journal file(s), while “journalctl -F FIELD” lists all values found for a particular field:
Piping the output of “-F” and “-N” into sort is highly recommended.
Commonly matched fields have shortcut options:
--facility= Matches on Syslog facility name or number
journalctl -q -o short --facility=authpriv(Gives output just like typical /var/log/auth.log files)
-t Matches SYSLOG_IDENTIFIER field
journalctl -q -o short -t sudo(When you just want to see messages from Sudo)
-u Matches _SYSTEMD_UNIT field
journalctl -q -o short -u ssh.service(Messages from sshd, the ".service" is optional)
# journalctl -q -r --utc -o short-iso -u ssh -g Accepted
2024-07-21T11:33:36+0000 LAB sshd[1478]: Accepted password for lab from 192.168.10.1 port 56282 ssh2
2024-07-21T11:22:02+0000 LAB sshd[1304]: Accepted password for lab from 192.168.10.1 port 56280 ssh2
2024-07-20T21:55:45+0000 LAB sshd[1559]: Accepted password for lab from 192.168.10.1 port 56278 ssh2
2024-07-20T21:44:55+0000 LAB sshd[1386]: Accepted password for lab from 192.168.10.1 port 56376 ssh2
[...]
TIME-BASED SELECTIONS
Specify time ranges with the “-S” (or “--since“) and “-U” (“--until“) options. The syntax for specifying dates and times is ridiculously flexible and is defined in the systemd.time(7) manual page. Here are some examples:
The Systemd journal also keeps track of when the system reboots and allows you to select messages that happened during a particular operating sessions of the machine. “--list-boots” gives a list of all of the reboots found in the current journal files and “-b” allows you to select one or more sessions:
# journalctl --list-boots
-3 f366a96b2f0a402a94e02eb57e10d431 Sun 2024-07-14 16:18:40 EDT—Thu 2024-07-18 08:53:12 EDT
-2 9ac272cac6c040a7b9ad021ba32c2574 Thu 2024-07-18 08:53:45 EDT—Sat 2024-07-20 08:55:50 EDT
-1 93616c3bb5794e0099520b2bf974d1bc Sat 2024-07-20 17:41:24 EDT—Sun 2024-07-21 07:17:12 EDT
0 5c57e83c3abd457c95d0695807667c9e Sun 2024-07-21 07:17:40 EDT—Sun 2024-07-21 14:17:52 EDT
# journalctl -q -r --utc -o short-iso -u ssh -g Accepted -b -1
2024-07-20T21:55:45+0000 LAB sshd[1559]: Accepted password for lab from 192.168.10.1 port 56278 ssh2
2024-07-20T21:44:55+0000 LAB sshd[1386]: Accepted password for lab from 192.168.10.1 port 56376 ssh2
TAIL-LIKE BEHAVIORS
When using journalctl on a live system, “journalctl -f” allows you to watch messages coming into the logs in real time. This is similar to using “tail -f” on a traditional Syslog-style log. You may still use all of the normal selectors to filter messages you want to watch for, as well as specify the usual output formats.
“journalctl -n” displays the last ten entries in the journal, similar to piping the output into tail. You may optionally specify a numeric argument after “-n” if you want to see more or less than ten lines.
However, the “-n” and “-g” (pattern matching) operators have a strange interaction. The pattern match is only applied to the lines selected by “-n” along with your other selectors. For example, we can extract the last ten lines associated with the SSH service:
# journalctl -q --utc -o short-iso -u ssh -n
2024-07-21T11:17:41+0000 LAB systemd[1]: Starting OpenBSD Secure Shell server...
2024-07-21T11:17:42+0000 LAB sshd[723]: Server listening on 0.0.0.0 port 22.
2024-07-21T11:17:42+0000 LAB sshd[723]: Server listening on :: port 22.
2024-07-21T11:17:42+0000 LAB systemd[1]: Started OpenBSD Secure Shell server.
2024-07-21T11:22:02+0000 LAB sshd[1304]: Accepted password for lab from 192.168.10.1 port 56280 ssh2
2024-07-21T11:22:02+0000 LAB sshd[1304]: pam_unix(sshd:session): session opened for user lab(uid=1000) by (uid=0)
2024-07-21T11:33:36+0000 LAB sshd[1478]: Accepted password for lab from 192.168.10.1 port 56282 ssh2
2024-07-21T11:33:36+0000 LAB sshd[1478]: pam_unix(sshd:session): session opened for user lab(uid=1000) by (uid=0)
2024-07-21T19:56:09+0000 LAB sshd[4013]: Accepted password for lab from 192.168.10.1 port 56284 ssh2
2024-07-21T19:56:09+0000 LAB sshd[4013]: pam_unix(sshd:session): session opened for user lab(uid=1000) by (uid=0)
But matching the lines containing the “Accepted” keyword only matches against the ten lines shown above:
# journalctl -q --utc -o short-iso -u ssh -g Accepted -n
2024-07-21T11:22:02+0000 LAB sshd[1304]: Accepted password for lab from 192.168.10.1 port 56280 ssh2
2024-07-21T11:33:36+0000 LAB sshd[1478]: Accepted password for lab from 192.168.10.1 port 56282 ssh2
2024-07-21T19:56:09+0000 LAB sshd[4013]: Accepted password for lab from 192.168.10.1 port 56284 ssh2
From an efficiency perspective I understand this choice. It’s costly to seek backwards through the journal doing pattern matches until you find ten lines that match your regular expression. But it’s certainly surprising behavior, especially when your pattern match returns zero matching lines because it doesn’t happen to get a hit in the last ten lines you selected.
Frankly, I just forget about the “-n” option and just pipe my journalctl output into tail.
Further Reading
I’ve attempted to summarize the information most important to DFIR professionals, but there is always more to know. For further information, start with the journalctl(1) manual page. Keep your journalctl cheat sheet handy and good luck out there!
Lately I’ve been thinking about Stephan Berger’s recent blog post on hiding Linux processes with bind mounts. Bottom line here is that if you have an evil process you want to hide, use a bind mount to mount a different directory on top of the /proc/PID directory for the evil process.
In the original article, Stephan uses a nearly empty directory to overlay the original /proc/PID directory for the process he is hiding. I started thinking about how I could write a tool that would populate a more realistic looking spoofed directory. But after doing some prototypes and running into annoying complexities I realized there is a much easier approach.
Why try and make my own spoofed directory when I can simply use an existing /proc/PID directory from some other process? If you look at typical Linux ps output, there are lots of process entries that would hide our evil process quite well:
These process entries with low PIDs and process names in square brackets (“[somename]“) are spontaneous processes. They aren’t running executables in the traditional sense– you won’t find a binary in your operating system called kthreadd for example. Instead, these are essentially kernel code dressed up to look like a process so administrators can monitor various subsystems using familiar tools like ps.
From our perspective, however, they’re a bunch of processes that administrators generally ignore and which have names that vary only slightly from one another. They’re perfect for hiding our evil processes:
Our evil process is now completely hidden. If somebody were to look closely at the ps output, they would discover there are now two entries for PID 78:
My guess is that nobody is going to notice this unless they are specifically looking for this technique. And if they are aware of this technique, there’s a much simpler way of detecting it which Stephan notes in his original article:
Just to be thorough, I’m dumping the content of all /proc/*/mount entries (/proc/mounts is a link to /proc/self/mounts) and looking for ones where the mount point is a /proc/PIDdirectory or one of its subdirectories. The “sort -ur” at the end gives us one instance of each unique mount point.
But why the “-r” option? I want to use my output to programmatically unmount the bind mounted directories. I was worried about somebody doing a bind mount on top of a bind mount:
While I think this scenario is extremely unlikely, using “sort -ur” means that the mount points are returned in the proper order to be unmounted. And once the bind mounts are umounted, we can see the evil process again.
Note that we do get an error here. /proc/78 is mounted on top of /proc/4867. So when we unmount /proc/78/fd we are also taking care of the spoofed path /proc/4867/fd. When our while loop gets to the entry for /proc/4867/fd, the umount command errors out.
Possible weird corner cases aside, let’s try and provide our analyst with some additional information:
root@LAB:~# function procbindmounts {
cat /proc/*/mounts | awk '$2 ~ /^\/proc\/[0-9]*($|\/)/ { print $2 }' | sort -ur |
while read dir; do
echo ===== POSSIBLE PROCESS HIDING $dir
echo -ne Overlay:\\t
cut -d' ' -f1-7 $dir/stat
umount $dir
echo -ne Hidden:\\t\\t
cut -d' ' -f1-7 $dir/stat
done
}
root@LAB:~# mount -B /proc/78 /proc/4867
root@LAB:~# procbindmounts
===== POSSIBLE PROCESS HIDING /proc/4867
Overlay: 78 (irq/29-pciehp) S 2 0 0 0
Hidden: 4867 (myevilprocess) S 1 4867 4759 34816
Thanks Stephan for getting my creative juices flowing. This is a fun technique for all you red teamers out there, and a good trick for all you blue team analysts.
This combination of factors should make it straightforward to recover deleted files. Let’s see if we can document this recovery process, shall we?
For this example, I created a directory containing 100 JPEG images and then deleted 10 images from the directory:
We will be attempting to recover the 0010.jpg file. I have included the file checksum and output of the file command in the screenshot above for future reference.
Examining the Directory
I will use xfs_db to dump the directory file. But first I need to know the device that contains the file system and the inode number of our test directory:
The directory file occupies a single block at address 2315557. We can use xfs_db to dump the contents of that block. Viewing the block as a directory isn’t all that helpful, though we can see the area of deleted directory entries in the output:
Array entry 11 shows the 0xffff marker that denotes the beginning of one or more deleted directory entries, and then we have the two-byte length value (0x00f0 or 240 bytes) of the length of that section.
But to see the actual contents of that region, we will need to get a hex dump view:
At offset 0x138 you can see the “ff ff” marking the start of the deleted entries and the “00 f0” length value. These four bytes overwrite the upper four bytes of the inode address of the 0010.jpg file, but the lower four bytes are still visible: “01 31 ed 06“.
Recall from my previous XFS write-ups that while XFS uses 64-bit addresses, the block and inode addresses are variable length and rarely occupy the entire 64-bit address space. The inode address length is based on the number of blocks in each allocation group, and the number of bits necessary to represent that many blocks. This is the agblklog value in the superblock:
xfs_db> sb 0
xfs_db> print agblklog
agblklog = 24
24 bits are required for the relative block offset in the AG. We need three additional bits to index the inode within the block– 27 bits in total. Everything above these 27 bits is the AG number, but assuming the default of four AGs per file system, the AG number only occupies two more bits. The inode address should fit in 29 bits, and so the inode residue we are seeing in the directory entry should be the entire original inode address. You can confirm this by looking at the deleted directory entries that follow the deleted 0010.jpg file— their upper 32 bits are untouched and they show all zeroes in the upper bits.
Examining the Inode
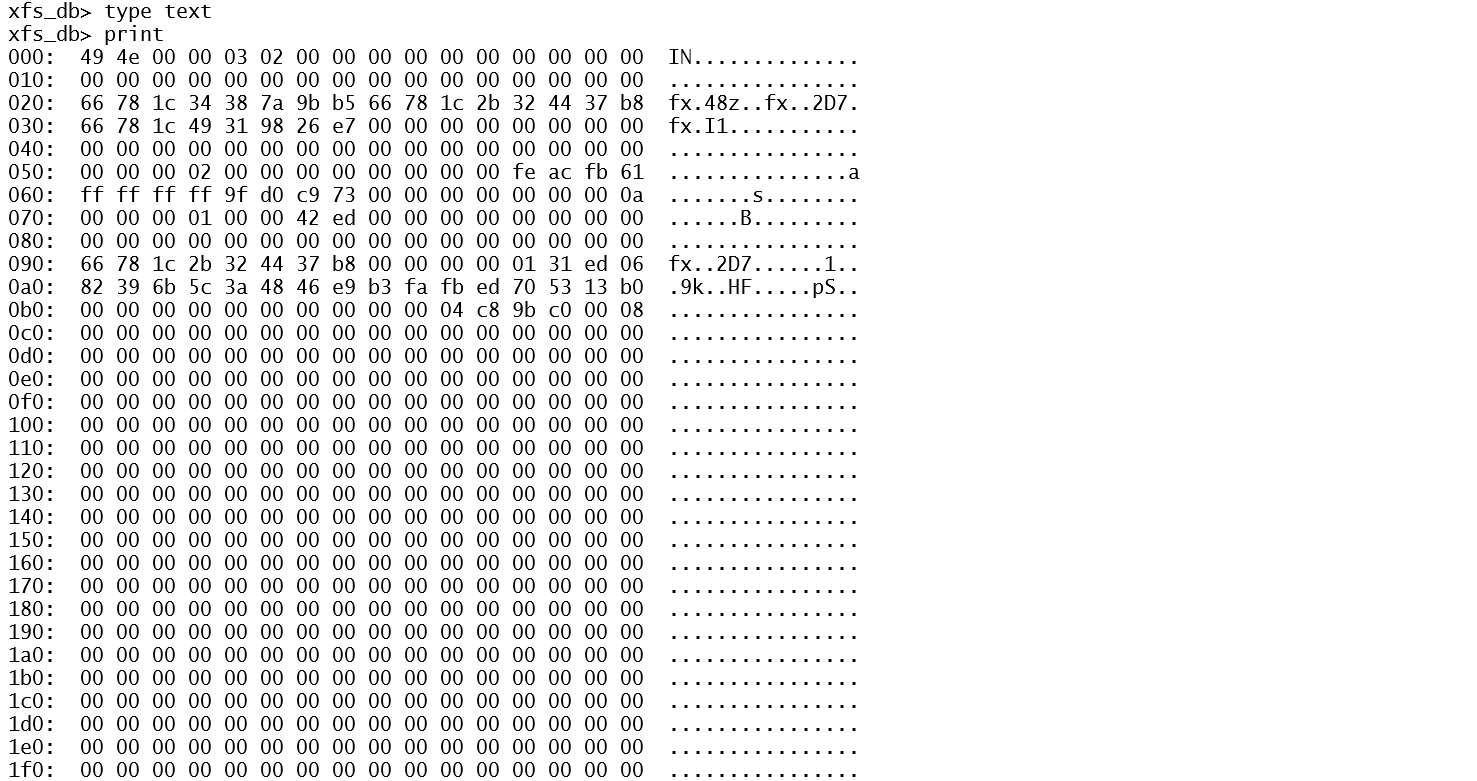
We have some confidence that the inode of the deleted 0010.jpg file is 0x0131ed06. We can use xfs_db to examine this inode. The normal output from xfs_db shows us that the file is empty and there are no extents:
However, viewing a hexdump of the inode shows the original extent structures:
The extents start at offset 0x0b0, immediately following the “inode core” region. Extents structures are 128 bits in length, so each line in the standard hexdump output format represents a single extent.
Recognizing that the standard, non-byte-aligned XFS extent structures are difficult to decode, I developed a small script called xfs-extents.sh that reads the extent structures from an inode and outputs dd commands that should dump the blocks specified in the extent. Simply provide the device name and the inode number:
The careful reader will note that the MD5 checksum on the recovered file does not match the checksum of the original file. This is due to the fact that the recovered file includes the null-filled slack space at the end of the final block that was ignored in the original checksum calculations. Unfortunately the original file size in the inode is zeroed when the file is deleted, so we have no idea of the exact length of the original file. All we can do is recover the entire block run of the file, including the slack space. We should still be able to view the original image in this case, even with the extra nulls tacked on to the end of the file.
Extra Credit Math Problem
With the help of xfs_db and my little shell script, we were able to recover the deleted file. However, retrieving the inode from the deleted directory entry was facilitated by the fact that the inode address was less than 32 bits long. So even though the upper 32 bits of the 64 address space was overwritten, we could still see the original inode number.
Since the length of the inode address is based on the number of blocks per AG, the question becomes how large the file system has to grow before the inode address, including the AG number in the upper bits, becomes longer than 32 bits? Once this happens, recovering the original inode address from deleted directory entries becomes problematic– at least for the first entry in a region of deleted directory entries. Remember from our example above the full 64-bit address space of the second and later deleted entries in the chunk are fully visible.
We need two bits to represent the AG number in a typical XFS file system, and three bits to represent the inode offset in the block. That leaves 27 of 32 bits for the relative block offset in the AG. So the maximum AG size is 2**28 – 1 or 268,435,455 blocks. Assuming the standard 4K block size, that’s 1024 gigabytes per AG, or a 4TB file system.
What if we were willing to sacrifice the upper two bits of AG number? After all, even if the AG number were overwritten, we could still try to find our deleted file simply by checking the relative inode address in each of the AGs until we find the file we’re looking for. With an extra two bits of room for the relative block offset, each AG could now be four times larger allowing us to have up to a 16TB file system before the relative inode address was larger than 32 bits.
I recently was given a survey to fill out by an organization I do training for. I suppose it’s a pretty predictable set of questions about who I am and how I got into the industry, and advice I have for people who are just starting out. But it caught me at just the right moment and I ended up going into some depth. So if you’re looking for a bit more about me and my journey, and maybe a little bit of life advice, read on!
What is your Name and Title?
My name is Hal Pomeranz, and I’m a “lone eagle”– an independent consultant running my own business.
Titles are a little weird when you are a one-man shop like I am. Officially I’m “President”, “CEO”, and a host of other titles. But it seems a bit grandiose to claim to be CEO of just little old me. “Consultant” or “Principal Consultant” seems a bit closer to the truth.
Tell me about what you do in that occupation?
They always say that running your own business is like working two jobs. The boring part of my business is the “business stuff”—contracts, invoicing, collections, taxes, insurance, etc. Frankly I try to automate or outsource as much of that nonsense as possible.
As far as technical work, my current practice is centered around Digital Forensics and Incident response—helping companies that have had a security incident figure out what happened and get fully operational again. But there are many different aspects to that general description. For example, right now I’m helping one of my clients proactively improve their detection capability to help spot incidents as early as possible.
I also create and teach training courses to help people learn to do some of what I do.
I’ve been diversifying my practice by taking on occasional Expert Witness work, acting as a technical expert and weighing in with my opinion on various court matters. Many of these cases have centered around tech support scams that target unsophisticated computer users—particularly the elderly.
Do you have any certifications or degrees?
I have a Bachelors in Math with a minor in Computer Science. I tried going back to grad school for my Masters at one point, but working in the industry was so much more fun!
I earned a raft of SANS/GIAC certifications because they had a policy that you had to be certified in any class you taught for them—including incidentally the course that I authored.
How do certifications help you out in the industry?
I’ve been working in IT for almost forty years at this point, so for me personally my experience counts for much more than any certification. But when you are first starting out, I understand the feeling that having certifications can help you pass through HR filters and generally make you stand out from your peers.
If you will forgive a bit of editorializing, I generally consider certifications to be a tax on our industry. The difficulty is that many employers lack the in-house expertise to differentiate qualified from unqualified candidates. They fall back on certifications as a CYA maneuver, “Well it’s a shame that candidate didn’t work out, but we did our due diligence and made sure they had the correct certifications.” I don’t know how to solve this problem.
Why did you choose these certs and degrees?
I was interested in computers from a very young age, but when I went to college in the mid-1980s, Computer Science was still not widely available as a major outside of pure tech schools. I went to college fully intending to study Electrical Engineering, which was one path into Computer Science. Then I found out that EE was a five-year degree program with essentially no room for electives. I decided a Math degree would be easier. My first college math class was Discrete Mathematics and that experience made me realize that an Applied Math degree supplemented with as many CS classes as I could take was pretty much exactly what I wanted to do.
What got you interested in IT/Cybersecurity?
I was always fascinated by computers. When I was 11 years old, I bought a used TRS-80 from a friend of the family using my paper route money. Just before I started high school, I bought one of the original IBM PCs—again with money I’d saved up from delivering newspapers.
Where did that interest in computers start? I’m not sure, but I can remember a couple of formative episodes. In the 1970s, I can remember my dad bringing home a (briefcase-sized) portable terminal, complete with acoustic coupler modem. I remember being blown away by the idea that you could just plop down near a phone and interact with computers all over the world. I also had a friend with a much older sister who married a guy who did IT consulting for a living. This guy had all the cool toys and lived a very nice lifestyle. That seemed like a great deal to me.
What was your first IT job?
By the time I got to college, I had enough PC experience that I got a work-study job doing tech support for the administrative departments at our school. I guess this was the first in a long line of IT support jobs.
Just before I arrived at school, the nascent Computer Science Program (not its own Department yet!) had received a grant to purchase a network of engineering workstations. The head of the program, in a moment of pure inspiration, decided to go with Sun Microsystems computers. But he didn’t have time to manage the network in addition to his teaching responsibilities. He drafted interested students to be System and Network Admins for our small network.
I was a user on that network and fascinated with the computer games of the time—Rogue, Nethack, XConq, and so on. I regularly maxed my disk quota installing these games in my home directory. The student admins got frustrated with this behavior and told me, “Here’s the root password. Install those games where everybody can use them!” The rest, as they say, is history. I spent my last three years at a very theoretical liberal arts college getting a vocational education in Unix System and Network Administration.
Towards the end of my senior year in college I knew that I did not want to head directly to grad school. I had been sending out resumes to local organizations that were using Sun computers—which I figured out by looking at the UUCP maps of the time—but was not getting much response. Then one day the phone rang in the CS lab. It was a recruiter looking to fill a Sun Admin role at AT&T Bell Labs. I interviewed and got the job, which was something of a miracle when I think back on some of the cringeworthy answers I gave during the interview!
What was your first cybersecurity job?
I was hired at AT&T Bell Labs Holmdel as a junior Sun System Administrator. The Labs at the time were engaged in the process of moving from mainframe Unix systems to distributed networks of primarily Sun systems. But my boss was also a big wheel in the internal Bell Labs computer security team, having caught an attacker who was abusing the AT&T long distance networks for many months. She saw that I had an interest in computer security and became an important mentor. Through her I got to meet Bell Labs infosec luminaries like Bill Cheswick and Steve Bellovin. Though I’ve had lots of different job titles over the years, all of my work since then has had at least some infosec component.
What advice would you have for someone who is looking to start a career in Information Technology?
Start by recognizing that there is no “ideal path”. Some of the best people in our industry got here by very roundabout paths. And despite what you might hear, they weren’t always “passionate” about computers or information security.
Get as broad an education as possible—and not just in STEM! I deliberately chose to go to a liberal arts school because I wanted to study many things besides science and engineering. And the perspectives I gained through that broad education have very much informed my technical career. And just maybe helped me avoid some of the burnout that is so prevalent in our industry.
Recognize that the technology you are training on today will not be around for your entire career. When I was going through school, CS classes were taught in the Pascal programming language! Learn fundamental concepts that you can apply to any technology—networking, routing, algorithms, data structures, cryptography, the “CIA triad” and so on. A long career in infosec is based on a broad knowledge of technology.
What might be some challenges or obstacles someone might face as they look at starting their career?
Standing out from the crowd seems to be the biggest problem for people starting out these days. There are a lot of folks who heard they can make a good living at computers and information security and there seem to be too many candidates vying for too few junior positions.
Research and blogging seem to me the best path for getting noticed. While your peers are flogging their guts out for the latest certifications, maybe you could be spending your time doing original research and documenting your findings. The availability of free virtualization means it’s never been easier to create your own personal lab environment.
A well-written blog shows interest and passion for the subject. It demonstrates your technical capabilities. And it also demonstrates your communication skills, which are becoming only more valuable in our industry.
What challenges have you faced in your career?
Simply having a career through multiple decades has been a challenge in and of itself. I’ve persevered through multiple recessions and various industry catastrophes. My key there has been diversification. I’ve been a system admin, a network admin, a security admin, a DBA, a network architect, a developer, a forensic analyst, an incident responder, an expert witness, a trainer and course author, a technical editor and author, and who knows what else. The best piece of advice I ever got was, “Learn one big new thing every year.” If you can do that, you will always find a way to be in demand.
On a personal level, many of the challenges have been learning to get out of my own way. Being open to learning and understanding that I was not always the smartest person in the room. Understanding the perspectives of my customers and putting their needs ahead of what I thought was “right” from my narrow perspective. Realizing that process and documentation (if done properly!) actually make things better rather than just being a drag. And frankly just trying to be less of an asshole to everybody I interact with.
What do you think are the most important non-technical skills for a student to learn?
Communication skills are number one. Pick a subject that you know very well. Can you succinctly document your knowledge so that somebody new to the subject can understand at least the basic concepts? Now can you explain that subject 1-on-1 with another person? Can you explain it to a room full of people?
How do you “think like a hacker?”
From my perspective, this mindset is all about anticipating failure. When you’re a system and network admin, you begin to learn what architectures work and which ones don’t work. You learn where the points of failure tend to occur. Eventually this becomes a bit of a “sixth sense” that you internalize without even thinking about it.
The hacker mindset is the same. What if this were to fail catastrophically? What could cause that to happen? Could I cause that to happen? How could I leverage that?
What advice do you have to avoid burnout?
I do believe in the usual advice. Have interests outside of computers and technology. Remember that you work so that you can live, not the other way around. Never be afraid to say, “No.” Take time off—and by that I mean real time off where you are not worrying about your job and day-to-day responsibilities.
But this advice comes from a place of extreme privilege. Many of you are out there struggling to afford your lives, working in a corrosive job environment, and fighting battles that may be hard for others to understand. I see you.
It is the responsibility for all of us with privilege to address some of the fundamental inequities in our society. Do whatever you can to make the world better for everybody. And I find that helping others works to combat burnout as well!
What advice do you have about imposter syndrome?
Every day in real life and on social media you are confronted with people who seem to be so much more confident and knowledgeable than you. But remember that you are only seeing at most 10% of who that person really is. Sure, if you compare 100% of you to the best 10% of every person you meet, you’re going to end up feeling not so good about yourself. But once you get to know these people, you realize that they have their own insecurities and “blind spots” just like you.
Get comfortable with the idea that while you can never know everything, you do know something and that something has value. And you can share that thing you know with other people. And they can share what they know with you and others. And we can all get better.
Why did you become a teacher?
I grew up in a very welcoming technical community and was fortunate to be mentored by a great number of people—some well-known, some not. There was an understanding that when I reached a level of expertise that I would “pay it forward” by teaching the next generation. I take that very seriously.
I was also fortunate to come of age in a time when large IT staffs were common. You would start work as a junior member of the team and receive on the job training from the senior admins. These days it seems like very small or even one person IT shops are the norm. You can’t learn everything from Google and Stack Overflow! Teaching and writing are my way of trying to provide that mentorship that I received in the early stages of my career.
Is there a moment in your career that shaped your approach to teaching?
I can remember watching Bill Cheswick present at one of the first USENIX conferences I attended. Bill was commanding the room with his knowledge while decked out in an Aloha shirt, cargo shorts, and Birkenstocks. And I realized that training didn’t have to be stuffy and academic. That was a powerful moment that’s stuck with me as I train others.
Do you feel that teaching has made you more knowledgeable?
You never learn a subject so thoroughly as when you need to teach it to somebody else. Creating course material and teaching have increased my understanding of technology in ways I never expected. And I learn things from my students every time I teach!
I hear people saying, “But I’m not an expert! Nobody wants to listen to me teach!” Nonsense! Expertise is a subjective marker and many people underrate their abilities. Start teaching even before you think you’re ready. Watch how your understanding grows rapidly.
In my last blog post, I covered Systemd timers and some of the forensic artifacts associated with them. I’m also a fan of Thiago Canozzo Lahr’s UAC tool for collecting artifacts during incident response. So I wanted to add the Systemd timer artifacts covered in my blog post to UAC. And it occurred to me that others might be interested in seeing how to modify UAC to add new artifacts for their own purposes.
UAC is a module-driven tool for collecting artifacts from Unix-like systems (including Macs). The user specifies a profile file containing the list of artifacts they want to collect and an output directory where that collection should occur. Individual artifacts may be added to or excluded from the list of artifacts in the profile file using individual command line arguments.
A typical UAC command might look like:
./uac -p ir_triage -a memory_dump/avml.yaml /root
Here we are selecting the standard ir_triage profile included with UAC (“-p ir_triage“) and adding a memory dump (“-a memory_dump/avml.yaml“) to the list of artifacts to be collected. Output will be collected in the /root directory.
UAC’s configuration files are simple YAML configuration files and can be easily customized and modified to fit your needs. Adding new artifacts usually means adding a few lines to existing configuration files, or rarely creating a new configuration module from scratch. I’m going to walk through a few examples, including showing you how I added the Systemd timer artifacts to UAC.
Before we get started, let’s go ahead and check out the latest version from Thiago’s Github:
The profiles directory contains the YAML formated profile files, including the ir_triage.yaml profile I referenced in my sample UAC command above:
$ ls profiles/
full.yaml ir_triage.yaml offline.yaml
The artifacts directory is an entire hierarchy of dozens of YAML files describing how to collect artifacts:
$ ls artifacts/
bodyfile chkrootkit files hash_executables live_response memory_dump
$ ls artifacts/memory_dump/
avml.yaml process_memory_sections_strings.yaml process_memory_strings.yaml
Modifying Profiles
While the default profiles that come with UAC are excellent starting points, you will often find yourself needing to tweak the list of artifacts you wish to collect. This can be done with the “-a” command line argument as noted above. But if you find yourself collecting the same custom list of artifacts over and over, it becomes easier to create your own profile file with your specific list of desired artifacts.
For example, let’s suppose were were satisfied with the basic list of artifacts in the ir_triage profile, but wanted to make sure we always tried to collect a memory image. Rather than adding “-a memory_dump/avml.yaml” to every UAC command, we could create a modified version of the ir_triage profile that simply includes this artifact.
First make a copy of the ir_triage profile under a new name:
You can see where we added the “memory_dump/avml.yaml” artifact right at the top of the list of artifacts to collect. It is also extremely important to modify the “name:” line at the top of the file so that this name matches the name of the YAML file for the profile (without the “.yaml” extension). UAC will exit with an error if the “name:” line doesn’t match the base name of the profile file you are trying to use.
Now that we have our new profile file, we can invoke it as “./uac -p ir_triage_memory /root“.
Adding Artifacts
To add specific artifacts, you will need to get into the YAML files under the “artifacts” directory. In my previous blog posting, I suggested collecting the output of “systemctl list-timers --all” and “systemctl status *.timers“. You’ll often be surprised to find that UAC is already collecting the artifact you are looking for:
version: 1.0
artifacts:
-
description: Display all systemd system units.
supported_os: [linux]
collector: command
command: systemctl list-units
output_file: systemctl_list-units.txt
-
description: Display timer units currently in memory, ordered by the time they elapse next.
supported_os: [linux]
collector: command
command: systemctl list-timers --all
output_file: systemctl_list-timers_--all.txt
-
description: Display unit files installed on the system, in combination with their enablement state (as reported by is-enabled).
supported_os: [linux]
collector: command
command: systemctl list-unit-files
output_file: systemctl_list-unit-files.txt
It looks like “systemctl list-timers --all” is already being collected. Following the pattern of the other entries, it’s easy to add in the configuration to collect “systemctl status *.timers“:
version: 1.1
artifacts:
-
description: Display all systemd system units.
supported_os: [linux]
collector: command
command: systemctl list-units
output_file: systemctl_list-units.txt
-
description: Display timer units currently in memory, ordered by the time they elapse next.
supported_os: [linux]
collector: command
command: systemctl list-timers --all
output_file: systemctl_list-timers_--all.txt
-
description: Get status from all timers, including logs
supported_os: [linux]
collector: command
command: systemctl status *.timer
output_file: systemctl_status_timer.txt
-
description: Display unit files installed on the system, in combination with their enablement state (as reported by is-enabled).
supported_os: [linux]
collector: command
command: systemctl list-unit-files
output_file: systemctl_list-unit-files.txt
Note that I was careful to update the “version:” line at the top of the file to reflect the fact that the file was changing.
As far as the various file artifacts we need to collect, I discovered that artifacts/files/system/systemd.yaml was already collecting many of the files we want:
In this case my changes only involved modifying existing artifacts files. If I had found it necessary to create new YAML files I would have also needed to add those new artifact files to my preferred UAC profile.
If you’ve been busy trying to get actual work done on your Linux systems, you may have missed the fact that Systemd continues its ongoing scope creep and has added timers. Systemd timers are a new task scheduling system that provide similar functionality to the existing cron (Vixie cron and anacron) and atd systems in Linux. And so this creates another mechanism that attackers can leverage for malware activation and persistence.
Systemd timers provide both ongoing scheduled tasks similar to cron jobs (what the Systemd documentation calls realtime timers) as well as one-shot scheduled tasks (monotomic timers) that are similar to atd style jobs. Standard Systemd timers are configured via two files: a *.timer file and a *.service file. These files must live in standard Systemd configuration directories like /usr/lib/systemd/system or /etc/systemd/system.
The *.timer file generally contains information about when and how the scheduled task will run. Here’s an example from the logrotate.timer file on my local Debian system:
This timer is configured to run daily within a one hour (AccuracySec=1h) random time window that Systemd deems is the most efficient time. Persistent=true means that the last time the timer ran will be tracked on disk. If the system sleeps during a period when this timer should have been activated, then the timer will run immediately on system wakeup. This is similar functionality to the traditional Anacron system in Linux.
The *.timer file may include a Unit= directive that specifies a *.service file to execute when the timer must run. However, as in this case, most *.timer files leave out the Unit= directive, which means that the timer will activate the corresponding logrotate.service file. The *.service file configures the program(s) the timer executes and other job parameters and security settings. Here’s the logrotate.service file from my Debian machine:
[Unit]
Description=Rotate log files
Documentation=man:logrotate(8) man:logrotate.conf(5)
RequiresMountsFor=/var/log
ConditionACPower=true
[Service]
Type=oneshot
ExecStart=/usr/sbin/logrotate /etc/logrotate.conf
# performance options
Nice=19
IOSchedulingClass=best-effort
IOSchedulingPriority=7
# hardening options
# details: https://www.freedesktop.org/software/systemd/man/systemd.exec.html
# no ProtectHome for userdir logs
# no PrivateNetwork for mail deliviery
# no NoNewPrivileges for third party rotate scripts
# no RestrictSUIDSGID for creating setgid directories
LockPersonality=true
MemoryDenyWriteExecute=true
PrivateDevices=true
PrivateTmp=true
ProtectClock=true
ProtectControlGroups=true
ProtectHostname=true
ProtectKernelLogs=true
ProtectKernelModules=true
ProtectKernelTunables=true
ProtectSystem=full
RestrictNamespaces=true
RestrictRealtime=true
Timers can be activated using the typical systemctl command line interface:
systemctl enable ensures the timer will be reactivated across reboots while systemctl start ensures that the timer is started in the current OS session.
You can get a list of all timers configured on the system (active or not) with systemctl list-timers --all:
# systemctl list-timers --all NEXT LEFT LAST PASSED UNIT ACTIVATES Sun 2024-05-05 18:33:46 UTC 1h 1min left Sun 2024-05-05 17:30:29 UTC 1min 58s ago anacron.timer anacron.service Sun 2024-05-05 19:50:01 UTC 2h 17min left Sun 2024-05-05 16:37:36 UTC 54min ago apt-daily.timer apt-daily.service Mon 2024-05-06 00:00:00 UTC 6h left Sun 2024-05-05 16:37:36 UTC 54min ago exim4-base.timer exim4-base.service Mon 2024-05-06 00:00:00 UTC 6h left Sun 2024-05-05 16:37:36 UTC 54min ago logrotate.timer logrotate.service Mon 2024-05-06 00:00:00 UTC 6h left Sun 2024-05-05 16:37:36 UTC 54min ago man-db.timer man-db.service Mon 2024-05-06 00:17:20 UTC 6h left Sun 2024-05-05 16:37:36 UTC 54min ago fwupd-refresh.timer fwupd-refresh.service Mon 2024-05-06 01:13:52 UTC 7h left Sun 2024-05-05 16:37:36 UTC 54min ago fstrim.timer fstrim.service Mon 2024-05-06 03:23:47 UTC 9h left Fri 2024-04-19 00:59:27 UTC 2 weeks 2 days ago systemd-tmpfiles-clean.timer systemd-tmpfiles-clean.service Mon 2024-05-06 06:02:06 UTC 12h left Sun 2024-05-05 16:37:36 UTC 54min ago apt-daily-upgrade.timer apt-daily-upgrade.service Sun 2024-05-12 03:10:20 UTC 6 days left Sun 2024-05-05 16:37:36 UTC 54min ago e2scrub_all.timer e2scrub_all.service
10 timers listed.
systemctl status can give you details about a specific timer, including the full path to where the *.timer file lives and any related log output:
# systemctl status logrotate.timer
● logrotate.timer - Daily rotation of log files
Loaded: loaded (/lib/systemd/system/logrotate.timer; enabled; vendor preset: enabled)
Active: active (waiting) since Thu 2024-04-18 00:44:25 UTC; 2 weeks 3 days ago
Trigger: Mon 2024-05-06 00:00:00 UTC; 6h left
Triggers: ● logrotate.service
Docs: man:logrotate(8)
man:logrotate.conf(5)
Apr 18 00:44:25 LAB systemd[1]: Started Daily rotation of log files.
Note that systemctl status *.timer will give this output for all timers on the system. This would be appropriate if you are quickly trying to gather this information for later triage.
If the command triggered by your timer produces output, look for that output with systemctl status <yourtimer>.service. For example:
# systemctl status anacron.service
● anacron.service - Run anacron jobs
Loaded: loaded (/lib/systemd/system/anacron.service; enabled; vendor preset: enabled)
Active: inactive (dead) since Sun 2024-05-05 18:34:45 UTC; 28min ago
TriggeredBy: ● anacron.timer
Docs: man:anacron
man:anacrontab
Process: 1563 ExecStart=/usr/sbin/anacron -d -q $ANACRON_ARGS (code=exited, status=0/SUCCESS)
Main PID: 1563 (code=exited, status=0/SUCCESS)
CPU: 2ms
May 05 18:34:45 LAB systemd[1]: Started Run anacron jobs.
May 05 18:34:45 LAB systemd[1]: anacron.service: Succeeded.
Systemd timer executions and command output are also logged to the LOG_CRON Syslog facility.
Transient Timers
Timers can be created on-the-fly without explicit *.timer and *.service files using the systemd-run command:
# systemd-run --on-calendar='*-*-* *:*:15' /tmp/.evil-lair/myStartUp.sh
Running timer as unit: run-rb68ce3d3c11a4ec79b508036776d2cb1.timer
Will run service as unit: run-rb68ce3d3c11a4ec79b508036776d2cb1.service
In this case, we are creating a timer that will run every minute of every hour of every day at 15 seconds into the minute. The timer will execute /tmp/.evil-lair/myStartUp.sh. Note that the systemd-run command requires that /tmp/.evil-lair/myStartUp.sh exist and be executable.
The run-*.timer and run-*.service files end up in [/var]/run/systemd/transient:
# cd /run/systemd/transient/
# ls
run-rb68ce3d3c11a4ec79b508036776d2cb1.service run-rb68ce3d3c11a4ec79b508036776d2cb1.timer session-2.scope session-71.scope session-c1.scope
# cat run-rb68ce3d3c11a4ec79b508036776d2cb1.timer
# This is a transient unit file, created programmatically via the systemd API. Do not edit.
[Unit]
Description=/tmp/.evil-lair/myStartUp.sh
[Timer]
OnCalendar=*-*-* *:*:15
RemainAfterElapse=no
# cat run-rb68ce3d3c11a4ec79b508036776d2cb1.service
# This is a transient unit file, created programmatically via the systemd API. Do not edit.
[Unit]
Description=/tmp/.evil-lair/myStartUp.sh
[Service]
ExecStart="/tmp/.evil-lair/myStartUp.sh"
These transient timers can be monitored with systemctl list-timers and systemctl status just like any other timer:
# systemctl list-timers --all -l
NEXT LEFT LAST PASSED UNIT ACTIVATES
Sun 2024-05-05 17:59:15 UTC 17s left Sun 2024-05-05 17:58:19 UTC 37s ago run-rb68ce3d3c11a4ec79b508036776d2cb1.timer run-rb68ce3d3c11a4ec79b508036776d2cb1.service
Sun 2024-05-05 18:33:46 UTC 34min left Sun 2024-05-05 17:30:29 UTC 28min ago anacron.timer anacron.service
Sun 2024-05-05 19:50:01 UTC 1h 51min left Sun 2024-05-05 16:37:36 UTC 1h 21min ago apt-daily.timer apt-daily.service
Mon 2024-05-06 00:00:00 UTC 6h left Sun 2024-05-05 16:37:36 UTC 1h 21min ago exim4-base.timer exim4-base.service
Mon 2024-05-06 00:00:00 UTC 6h left Sun 2024-05-05 16:37:36 UTC 1h 21min ago logrotate.timer logrotate.service
Mon 2024-05-06 00:00:00 UTC 6h left Sun 2024-05-05 16:37:36 UTC 1h 21min ago man-db.timer man-db.service
Mon 2024-05-06 00:17:20 UTC 6h left Sun 2024-05-05 16:37:36 UTC 1h 21min ago fwupd-refresh.timer fwupd-refresh.service
Mon 2024-05-06 01:13:52 UTC 7h left Sun 2024-05-05 16:37:36 UTC 1h 21min ago fstrim.timer fstrim.service
Mon 2024-05-06 03:23:47 UTC 9h left Fri 2024-04-19 00:59:27 UTC 2 weeks 2 days ago systemd-tmpfiles-clean.timer systemd-tmpfiles-clean.service
Mon 2024-05-06 06:02:06 UTC 12h left Sun 2024-05-05 16:37:36 UTC 1h 21min ago apt-daily-upgrade.timer apt-daily-upgrade.service
Sun 2024-05-12 03:10:20 UTC 6 days left Sun 2024-05-05 16:37:36 UTC 1h 21min ago e2scrub_all.timer e2scrub_all.service
11 timers listed.
# systemctl status run-rb68ce3d3c11a4ec79b508036776d2cb1.timer
● run-rb68ce3d3c11a4ec79b508036776d2cb1.timer - /tmp/.evil-lair/myStartUp.sh
Loaded: loaded (/run/systemd/transient/run-rb68ce3d3c11a4ec79b508036776d2cb1.timer; transient)
Transient: yes
Active: active (waiting) since Sun 2024-05-05 17:48:25 UTC; 10min ago
Trigger: Sun 2024-05-05 17:59:15 UTC; 3s left
Triggers: ● run-rb68ce3d3c11a4ec79b508036776d2cb1.service
May 05 17:48:25 LAB systemd[1]: Started /tmp/.evil-lair/myStartUp.sh.
Note that these timers are transient because the /var/run directory is an in-memory file system. These timers, like the file system itself, will disappear on system shutdown or reboot.
Per-User Timers
Systemd also allows unprivileged users to create timers. The command line interface we’ve seen so far stays essentially the same except that regular users must add the --user flag to all commands. User *.timer and *.service files must be placed in $HOME/.config/systemd/user. Or the user could create a transient timer without explicit *.timer and *.service files:
$ systemd-run --user --on-calendar='*-*-* *:*:30' /tmp/.dropper/.src.sh
Running timer as unit: run-rdad04b63554a4ebeb12bc5ca42baaa31.timer
Will run service as unit: run-rdad04b63554a4ebeb12bc5ca42baaa31.service
The user can use systemctl list-timers and systemctl status to check on their timers:
$ systemctl list-timers --user --all
NEXT LEFT LAST PASSED UNIT ACTIVATES
Sun 2024-05-05 18:20:30 UTC 40s left n/a n/a run-rdad04b63554a4ebeb12bc5ca42baaa31.timer run-rdad04b63554a4ebeb12bc5ca42baaa31.service
1 timers listed.
$ systemctl status --user run-rdad04b63554a4ebeb12bc5ca42baaa31.timer
● run-rdad04b63554a4ebeb12bc5ca42baaa31.timer - /tmp/.dropper/.src.sh
Loaded: loaded (/run/user/1000/systemd/transient/run-rdad04b63554a4ebeb12bc5ca42baaa31.timer; transient)
Transient: yes
Active: active (waiting) since Sun 2024-05-05 18:19:35 UTC; 32s ago
Trigger: Sun 2024-05-05 18:20:30 UTC; 22s left
Triggers: ● run-rdad04b63554a4ebeb12bc5ca42baaa31.service
May 05 18:19:35 LAB systemd[1293]: Started /tmp/.dropper/.src.sh.
As you can see in the above output, transient per-user run-*.timer and run-*.service files end up under [/var]/run/user/<UID>/systemd/transient.
Unfortunately, there does not seem to be a way for the administrator to conveniently query timers for regular users on the system. You’re left with consulting the system logs and grabbing whatever on-disk artifacts you can, like the user’s $HOME/.config/systemd directory.
Orphan processes can sometimes cause confusion when analyzing live Linux systems. But during a recent run of my Linux Forensics class, one of my students showed me an interesting trick that I wanted to make more generally known.
At the top is the master SSH server for this system. Its parent process ID (PPID) is one, because it was started by systemd when the machine booted. Then we have the root-owned sshd process that was started when I connected to the system, and an unprivileged sshd because of the PrivilegeSeparation feature. That unprivileged sshd starts my bash login shell, and from that shell I fired up a ping command to run in the background. You can walk all the way back up the chain and in each case the PPID of each process is the PID of the process before it.
This makes it easy to view these processes as a hierarchy using a tool like pstree:
Analysts can confuse an orphaned process with one that was started by systemd, and this creates an opportunity for bad actors to obfuscate processes that they started interactively.
/proc to the Rescue!
What my student pointed out to me is that the original PPID of the ping process is still tracked under the /proc/<pid> directory for the process. For example, /proc/1415/status shows the original PPID under the NSsid (Namespace Session ID) field:
More tersely, you can see the original PPID as the sixth field in /proc/1415/stat:
1415 (ping) S 1 1415 1352 0 -1 4194560 ...
If you compare this with the output of the master sshd process that was actually started by systemd, you will notice a difference in this field. Here’s /proc/725/status:
In these cases, the process NSsid is the PID of the process started by systemd.
That’s Session ID
There’s one more subtlety at play here. I’m going to start two new ping processes: one in my login shell, and then one after I use sudo to become root:
The parameter is called Name Space Session ID because it applies to the entire user session that is initiated when the user logs in. So even though I used sudo to become the root user, the NSsid is still the PID of my unprivileged login shell. Or, for example, if an attacker manages to escalate privilege in the middle of their session, you can still use the NSsid to tie together processes they may have started in their root shell with processes from the original unprivileged session.
Web Shells and cron Jobs
That got me curious about some other potential scenarios: web shells and cron jobs. I installed the nginx web server along with PHP-FPM. I created a simple web shell in PHP that just invoked any command I passed to it with system(). This means that PHP-FPM will invoke /bin/sh first, which will then execute the command I pass in. The process hierarchy ended up looking like this:
Notice that the ping processes here have been orphaned and show no relation to the original cron process that launched them. When I checked the NSsid values of these processes, here is what I found:
Each process had a distinct NSsid and none of them matched the PID of the parent cron process. Like system(), cron runs a shell to execute each cron job. But unlike the PHP-FPM example, each shell spawned by cron starts a new session with a new NSsid value. The ping processes were orphaned when shells exited after launching the ping processes.
Bottom line is that processes that were started by systemd have their own PID as the NSsid. Processes started interactively, or launched from other services such as PHP-FPM or cron have some other PID in the NSsid field. Exactly what PID that is can vary depending upon how the process was launched. The NSsid field persists even when the process has been orphaned.
Unfortunately, once the process has been orphaned, we can’t recreate the entire original process hierarchy without additional data that’s not available by default. To rebuild the process hierarchies you would need to be tracking exec() system calls with auditd or eBPF, or using a third-party tool.
Just to see what would happen, I created a directory containing 5000 files. Let’s start with the inode:
The number of extents (bytes 76-79) is 0x2A, or 42. This is too many extents to fit in an extent array in the inode. The data fork type (byte 5) is 3, which means the data fork is the root of a B+Tree.
The root of the B+Tree starts at byte offset 176 (0x0B0), right after the inode core. The first two bytes are the level of this node in the tree. The value 1 indicates that this is an interior node in the tree, rather than a leaf node. The next two bytes are the number of entries in the arrays which track the nodes below us in the tree– there is only one node and one array entry. Four padding bytes are used to maintain 64-bit alignment.
The rest of the space in the data fork is divided into two arrays for tracking sub-nodes. The first array is made up for four byte logical offset values, tracking where each chunk of file data belongs. The second array is the absolute block address of the node which tracks the extents at the corresponding logical offset. In our case that block is 0x8118e4 = 8460516 (aka relative block 71908 in AG 2), which tracks the extents starting from the start of the file (logical offset zero).
This is a small file system and the absolute block addresses fit in 32 bits. What’s not clear in the documentation is what happens when the file system is large enough to require 64-bit block addresses? More research is needed here.
Let’s examine block 8460516 which holds the extent information. Here are the first 256 bytes in a hex editor:
0-3 Magic number BMA3
4-5 Level in tree 0 (leaf node)
6-7 Number of extents 42
8-15 Left sibling pointer -1 (NULL)
16-23 Right sibling pointer -1 (NULL)
24-31 Sector offset of this block 0x02595720 = 39409440
32-39 LSN of last update 0x200000631b
40-55 UUID e56c...da71
56-63 Inode owner of this block 0x022f4d7d = 36654461
64-67 CRC32 of this block 0x9d14d936
68-71 Padding for 64-bit alignment zeroed
This node is at level zero in the tree, which means it’s a leaf node containing data. In this case the data is extent structures, and there are 42 of them following the header.
If there were more than one leaf node, the left and right sibling pointers would be used. Since we only have the one leaf, both of these values are set to -1, which is used as a NULL pointer in XFS metadata structures.
As far as decoding the extent structures, it’s easier to use xfs_db:
As we saw in the previous installment, multi-block directories in XFS are sparse files:
Starting at logical offset zero, we have extents 1-33 containing the first 35 blocks of the directory file. This is where the directory entries live.
Extents 34-41 starting at logical offset 8388608 (XFS_DIR2_LEAF_OFFSET) contain the hash lookup table for finding directory entries.
Because the hash lookup table is large enough to require multiple blocks, the “tail record” for the directory moves into its own block tracked by the final extent (extent 42 in our example above). The logical offset for the tail record is 2*XFS_DIR2_LEAF_OFFSET or 16777216.
The Tail Record
0-3 Magic number XDF3
4-7 CRC32 checksum 0xf56e9aba
8-15 Sector offset of this block 22517032
16-23 Last LSN update 0x200000631b
24-39 UUID e56c...da71
40-47 Inode that points to this block 0x022f4d7d
48-51 Starting block offset 0
52-55 Size of array 35
56-59 Array entries used 35
60-63 Padding for 64-bit alignment zeroed
The last two fields describe an array whose elements correspond to the blocks in the hash lookup table for this directory. The array itself follows immediately after the header as shown above. Each element of the array is a two-byte number representing the largest chunk of free space available in each block. In our example, all of the blocks are full (zero free bytes) except for the last block which has at least a 0x0440 = 1088 byte chunk available.
Decoding the Hash Lookup Table
The hash lookup table for this directory is contained in the fifteen blocks starting at logical file offset 8388608. Because the hash lookup table spans multiple blocks, it is also formatted as a B+Tree. The initial block at logical offset 8388608 should be the root of this tree. This block is shown below.
0-3 "Forward" pointer 0
4-7 "Back" pointer 0
8-9 Magic number 0x3ebe
10-11 Padding for alignment zeroed
12-15 CRC32 checksum 0x129cf461
16-23 Sector offset of this block 22517064
24-31 LSN of last update 0x200000631b
32-47 UUID e56c...da71
48-55 Parent inode 0x022f4d7d
56-57 Number of array entries 14
58-59 Level in tree 1
59-63 Padding for alignment zeroed
We confirm this is an interior node of a B+Tree by looking at the “Level in tree” value at bytes 58-59– interior nodes have non-zero values here. The “forward” and “back” pointers being zeroed mean there are no other nodes at this level, so we’re sitting at the root of the tree.
The fourteen other blocks that hold the directory entries are tracked by an array here in the root block. Bytes 56-57 track the size of the array, and the array itself starts at byte 64. Each array entry contains a four byte hash value and a four byte logical block offset. The hash value in each array entry is the largest hash value in the given block.
If you look at the residual data in the block after the hash array, it looks like hash values and block offsets similar to what we’ve seen in previous installments. I speculate that this is residual data from when the hash lookup table was able to fit into a single block. Once the directory grew to a point where the B+Tree was necessary, the new B+Tree root node simply took over this block, leaving a significant amount of residual data in the slack space.
To understand the function of the leaf nodes in the B+Tree, suppose we wanted to find the directory entry for the file “0003_smallfile”. First we can use xfs_db to compute the hash value for this filename:
xfs_db> hash 0003_smallfile
0xbc07fded
According to the array, that hash value should be in logical block 8388614. We then have to refer back to the list of extents we decoded earlier to discover that this local offset corresponds to block address 8460517 (AG 2, block 71909). Here is the breakdown of that block:
0-3 Forward pointer 0x800001 = 8388609
4-7 Back pointer 0x800008 = 8388616
8-9 Magic number 0x3dff
10-11 Padding for alignment zeroed
12-15 CRC32 checksum 0xdb227061
16-23 Sector offset of this block 39409448
24-31 LSN of last update 0x200000631b
32-47 UUID e56c...da71
48-55 Parent inode 0x022f4d7d
56-57 Number of array entries 0x01a0 = 416
58-59 Unused entries 0
59-63 Padding for alignment zeroed
Following the 64-byte header is an array holding the hash lookup structures. Each structure contains a four byte hash value and a four byte offset. The array is sorted by hash value for binary search. Offsets are in 8 byte units.
The has value for “0003_smallfile” was 0xbc07fded. We have to look fairly far down in the array to find the offset for this value:
The offset tells us that the directory entry of “0003_smallfile” should be 0x13 = 19 * 8 = 152 bytes from the start of the directory file. That puts it near the beginning of the first block at logical offset zero.
The Directory Entries
To find the first block of the directory file we need to refer back to the extent list we decoded from the inode at the very start of this article. According to that list, the initial block is 4581802 (AG 1, block 387498). Let’s take a closer look at this block:
0-3 Magic number XDD3
4-7 CRC32 checksum 0xaf173b31
8-15 Sector offset to this block 22517072
16-23 LSN of last update 0x200000631b
24-39 UUID e56c...da71
40-47 Parent inode 0x022f4d7d
Bytes 48-59 are a three element array indicating where there is available free space in this directory. Each array element is a 2 byte offset (in bytes) to the free space and a 2 byte length (in bytes). There is no free space in this block, so all array entries are zeroed. Bytes 60-63 are padding for alignment.
Following this header are variable length directory entries defined as follows:
Len (bytes) Field
=========== ======
8 absolute inode number
1 file name length (bytes)
varies file name
1 file type
varies padding as necessary for 64bit alignment
2 offset to beginning of this entry
Here is the decoding of the directory entries shown above:
File type bytes are as described in Part Three of this series (1 is a regular file, 2 is a directory). Note that the starting offset of the “0003_smallfile” entry is 152 bytes (0x0098), exactly as the hash table lookup told us.
What Happens Upon Deletion?
Let’s see what happens when we delete “0003_smallfile”. When doing this sort of testing, always be careful to force the file system cache to flush to disk before busting out the trusty hex editor:
The mtime and ctime in the directory inode are set to the deletion time of “0003_smallfile”. The LSN and CRC32 checksum in the inode are also updated.
The removal of a single file is typically not a big enough event to modify the size of the directory. In this case, neither the extent tree root or leaf block changes. We would have to purge a significant number of files the impact this data.
However, the “tail record” for the directory is impacted by the file deletion.
The CRC32 checksum and LSN (now highlighted in red) are updated. Also the free space array now shows 0x20 = 32 bytes free in the first block.
Again, a single file deletion is not significant enough to impact the root of the hash B+Tree. However, one of the leaf nodes does register the change.
Again we see updates to the CRC32 checksum and LSN fields. The “Unused entries” field for the hash array now shows one unused entry. Looking farther down in the block, we find the unused entry for our hash 0xbc07fded. The offset is zeroed to indicate this entry is unused. We saw similar behavior in other block-based directories in previous installments of this series.
Changes to the directory entries are also similar to the behavior we’ve seen previously for block-based directory files:
Again we see the usual CRC32 and LSN updates. But now the free space array starting at byte 48 shows 0x0020 = 32 bytes free at offset 0x0098 = 152. The first two bytes of the inode field in this directory are overwritten with 0xFFFF to indicate the unused space, and the next two bytes indicate 0x0020 = 32 bytes of free space. However, since the inodes in this file system fit in 32 bits, the original inode number for the file is still fully visible and the file could potentially be recovered using residual data in the inode.
Wrapping Up and Planning for the Future
This post concludes my walk-through of the major on-disk data structures in the XFS file system. If anything was unclear or you want more detailed explanations in any area, feel free to reach me through the comments or via any of my social media accounts.
The colorized hex dumps that appear in these posts where made with a combination of Synalize It! and Hexinator. Along the way I created “grammar” files that you can use to produce similar colored breakdowns on your own XFS data structures.
I have multiple pages of research questions that came up as I was working through this series. But what I’m most interested in at the moment is the process of recovering deleted data from XFS file systems. This is what I will be looking at in upcoming posts.